
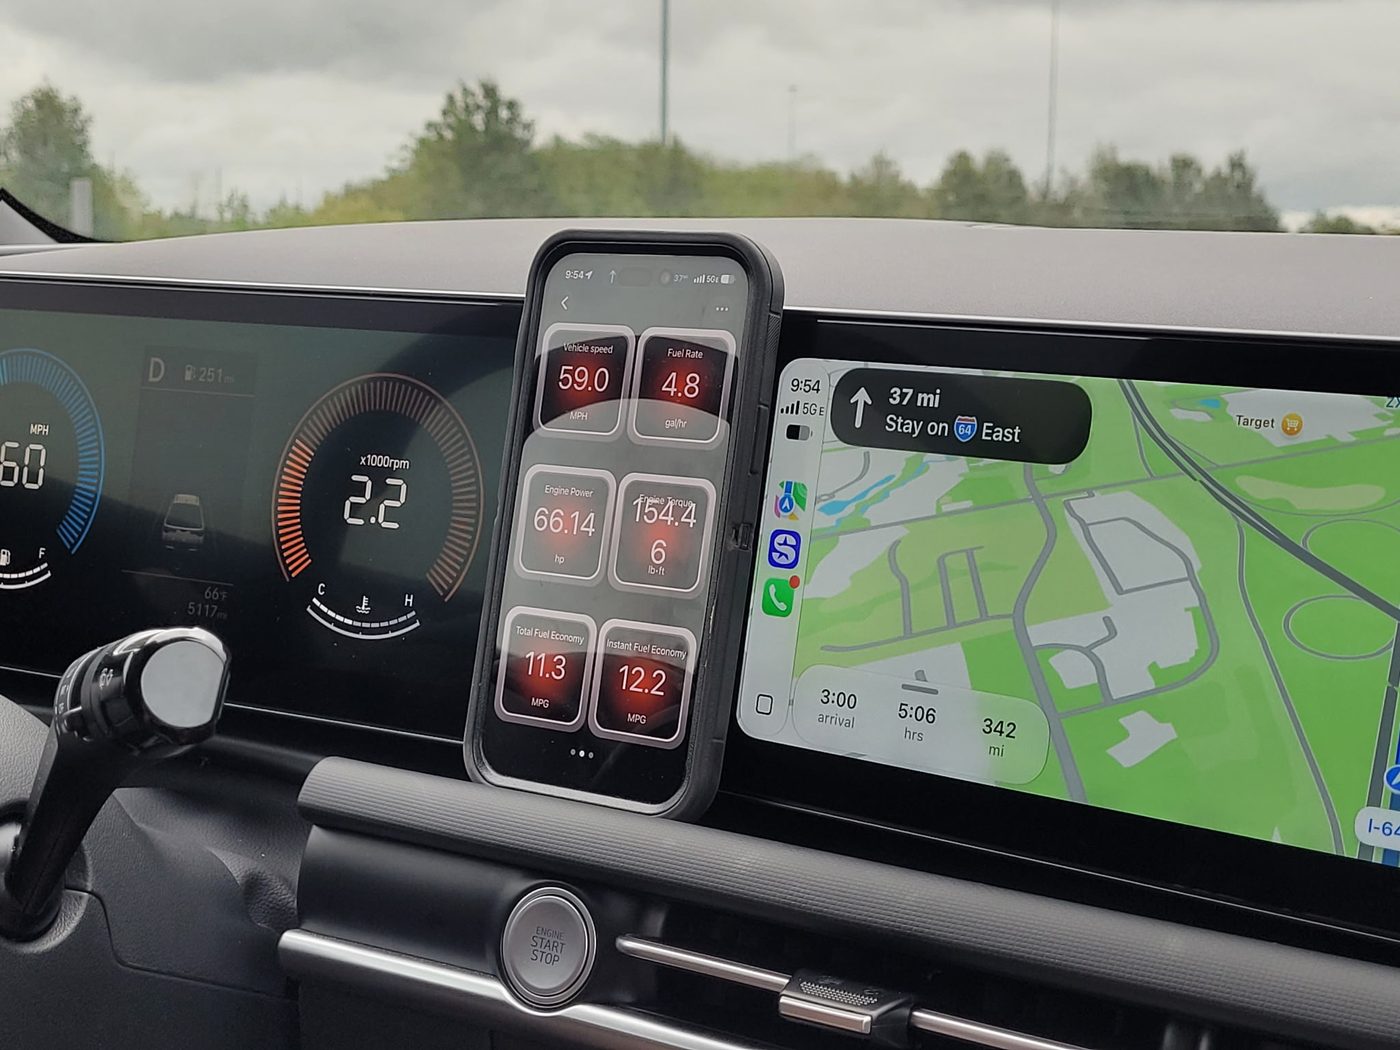
On our Missouri-to-Nashville RV trip, I wanted more than the Santa Cruz’s factory gauges could tell me. I plugged in an OBDLink MX+ and logged engine and vehicle data while towing our 2026 KZ Sportsmen Classic 130RD with a 2026 Hyundai Santa Cruz 2.5L non-turbo. The result is a useful field record: seven CSV files spanning about 570 logged miles on September 24 and 26, 2026. It also shows one thing I could not measure: transmission temperature.
I was pleased with the MX+ overall. It gave me a clearer view of speed, RPM, coolant temperature, throttle, and an estimated MPG reading. The catch is that useful monitoring takes some setup and attention. A few stops broke logging into separate files, and the custom transmission-temperature field remained at zero.
Our tow combination and what the logs cover
Our Santa Cruz has the naturally aspirated 2.5L engine, with a stated 3,500-pound tow rating for this configuration. The KZ 130RD’s published unloaded weight is about 2,690 pounds and its GVWR is 3,500 pounds. Those are manufacturer figures, not a scale ticket for our loaded trailer. A rating alone does not tell you actual tongue weight, payload, or whether a particular loaded combination is within every limit; check your own vehicle documents and weigh your rig.
The files cover about 357.0 miles on September 24 and 213.4 miles on September 26. They are logged miles, not a claim that every mile of the round trip was captured. I integrated each recorded speed over the elapsed sample intervals and limited unusually long gaps between samples. Fuel stops and other breaks interrupted the record. The app’s trip MPG fields are estimates; we did not establish fill-to-fill fuel economy with receipts.
For the route, campground, and towing decisions around these readings, see our RV road trip to Nashville. The gear we actually used puts the scanner and other trip equipment in context.
What the Santa Cruz did in the recorded miles
| Log group | Logged distance | Coolant 1 average* | RPM average* | Peak coolant 1 | Peak speed |
|---|---|---|---|---|---|
| Sept. 24 outbound | 357.0 mi | 198.7°F | 2,591 | 222.8°F | 75.2 mph |
| Sept. 26 available return logs | 213.4 mi | 200.2°F | 2,555 | 222.8°F | 71.5 mph |
*Arithmetic mean of nonzero readings in the available CSV rows, rounded. These are not time-weighted or controlled comparisons. The files include some zero readings around startup and stops; excluding those prevents a stopped or missing sensor value from distorting the engine averages.
The outbound coolant median was 197.6°F and its 95th percentile was 213.8°F. The high points were brief: in the longest outbound file, about 4.4 minutes exceeded 220°F over roughly 243.5 minutes of recorded time. The maximum in these files was 222.8°F. That is a description of the log, not a diagnosis or a universal safe-temperature threshold. If a warning appears, follow the vehicle’s guidance rather than relying on my trip numbers.
RPM tells a similar story about momentary versus sustained events. The highest recorded sample was about 5,889 RPM outbound and 5,219 RPM in the return logs. Those are peaks, not cruising RPM. Across readings at 55 mph and above, the median was about 2,946 RPM. About 95% of all recorded RPM readings were under 3,850. The actual engine-percent-torque parameter peaked at 75% outbound and 73% in the return logs; it is an OBD parameter, not a dynamometer measurement of wheel torque.
Which towing speed looked most efficient?
I grouped every valid moving sample at 45 mph and above into speed bands. The table uses the median instantaneous MPG reported by the app, alongside the median RPM, throttle, and engine-percent-torque readings. That choice reduces the influence of very high instant-MPG numbers while coasting. It does not turn separate stretches of road into a controlled same-road test.
| Speed band | Logged miles | Median instant MPG* | Median RPM | Median throttle | Median torque parameter |
|---|---|---|---|---|---|
| 45–49 mph | 15.7 | 15.1 | 2,383 | 34.9% | 48% |
| 50–54 mph | 33.7 | 14.9 | 2,569 | 39.2% | 51% |
| 55–59 mph | 88.1 | 13.5 | 2,720 | 43.1% | 55% |
| 60–64 mph | 206.4 | 12.4 | 2,963 | 49.8% | 57% |
| 65–69 mph | 163.9 | 11.6 | 3,116 | 51.0% | 58% |
| 70+ mph | 16.9 | 10.4 | 3,361 | 59.6% | 62% |
*OBD-derived instantaneous estimates, not fill-to-fill MPG for each band. Logged distances are the sum of speed × elapsed time within each band, rounded. Median coolant readings did not rise with speed in these unmatched road segments; they ranged from 201.2°F at 45–49 mph to 194.0°F at 65–69 mph. We cannot attribute the coolant differences to speed alone.
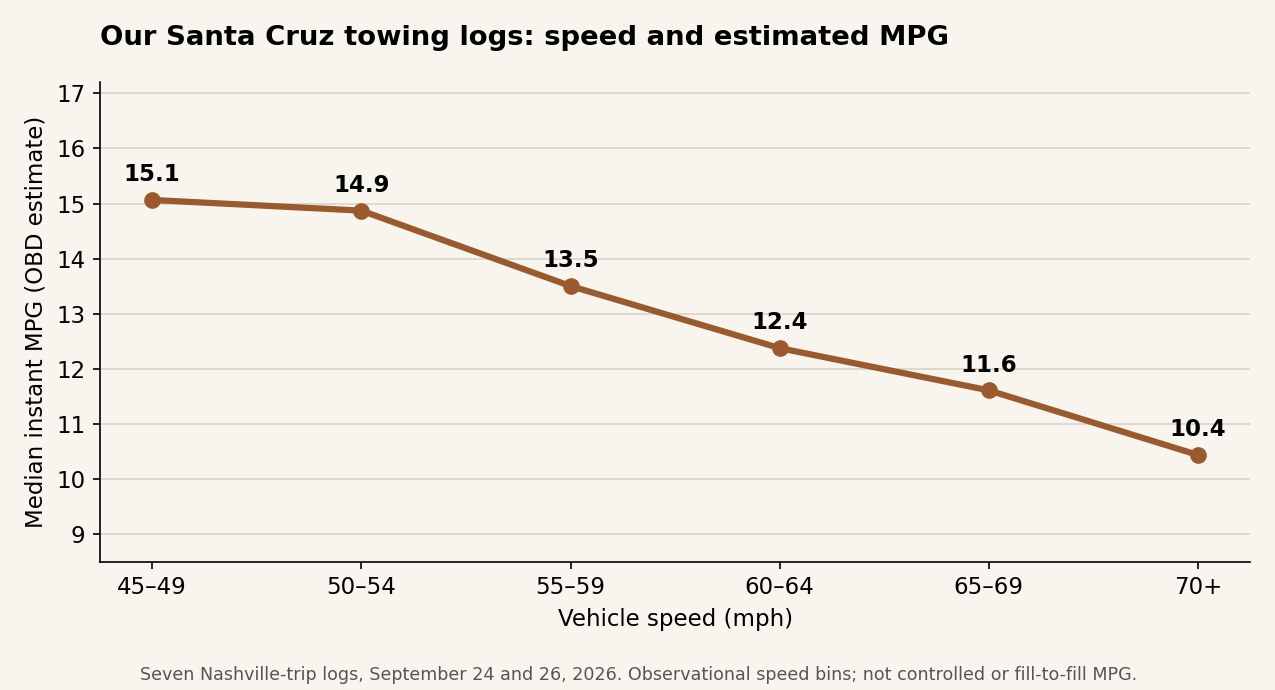
The lowest bands showed the best reported MPG, but 45–54 mph represented only about 49 miles combined and may be too slow for some highway traffic. For a practical compromise on this trip, 55–64 mph looked reasonable when conditions and posted limits allowed it. At 55–59, median instant MPG was 13.5 across 88 miles; at 60–64 it was 12.4 across 206 miles. Moving into 65–69 brought a lower 11.6 median and higher RPM and throttle. Above 70, the reported median fell to 10.4, but the sample was short. That pattern is consistent with a rising workload at higher speeds; the logs cannot isolate aerodynamic drag from grades, wind, acceleration, traffic, or gear selection.
I would start by choosing a safe speed for the road and trailer, then use a consistent stretch to observe RPM and temperatures. I would not chase one MPG number while driving. Speed limits, traffic flow, tire and trailer ratings, weather, and control of the rig come first.
Trip MPG is useful, but it is not pump math
The last app trip-MPG readings in the seven sessions, combined by each session’s logged miles and estimated gallons, work out to roughly 11.3 MPG outbound and 12.2 MPG in the available return logs. That is an aggregate of OBD-derived app estimates, with rounding and gaps. It is not a measured full-tank comparison, and the return files cover less distance. Do not interpret the difference as proof that one direction, fuel, speed, or setting caused a gain.
The transmission-temperature field did not work
This is the limitation I most wanted to know before the trip. The CSVs contain a custom field labeled Pid (°F). It reads 0°F in every row of every file. That is not a real transmission-fluid temperature. With this configuration, I did not obtain a functioning transmission-temperature PID for our 2026 Santa Cruz. I will not guess a temperature from coolant readings or imply that the MX+ supplied one.
OBDLink’s transmission-temperature guide explains that this is an OEM-specific parameter and describes checking enhanced add-ons and available manufacturer PIDs. Whether a specific PID works depends on the vehicle, software, and setup. My next step would be to verify the current Hyundai/Kia add-on coverage for this exact vehicle, choose a supported sensor if one exists, and confirm a plausible changing reading before making another towing log. A zero field is evidence of an unsuccessful setup, not evidence of a cold transmission.
What I liked, and what I would change
- Useful visibility: Seeing RPM, coolant, throttle, speed, and engine-load-related readings gave me more context than the factory display alone.
- Actual records: Exported CSVs let me revisit a concern after the drive instead of relying on memory.
- Logging friction: After shutting the Santa Cruz off for fuel or a break, I sometimes had to reconnect the app and restart logging. Forgetting creates a gap.
- Setup matters: I would verify every custom gauge, especially transmission temperature, before relying on it. I would also check that logging resumed after each stop.
The MX+ makes sense for an owner willing to choose useful parameters, watch for implausible values, and interpret the data conservatively. It does not weigh the trailer, certify a tow rating, replace warning lights, or turn estimated MPG into a laboratory test. Our CURT Echo Mobile road test covers the other electronic part of our towing setup: actual trailer-brake control, not engine monitoring.
Quick questions from this test
Can the OBDLink MX+ show 2026 Santa Cruz transmission temperature?
We did not obtain a working value. Our logged custom Pid (°F) column was zero throughout. Check OBDLink’s current vehicle-specific coverage and validate a plausible live PID before depending on it.
What MPG did our Santa Cruz get while towing?
The app’s session estimates aggregate to about 11.3 outbound and 12.2 in the available return logs. They are not fill-to-fill fuel economy. Instantaneous readings by speed band answer a different question and should not be confused with those trip estimates.
Was 70 mph the best towing speed?
No efficiency claim follows from the log. The 70-plus samples showed lower median instant MPG, higher RPM, and higher throttle than the 55–64 mph bands, but they covered only about 17 miles and were not a controlled comparison.
My take
I would use the MX+ again. It made the tow more understandable, and the files gave me evidence to review later. The most valuable habit was checking that the numbers made sense and that logging was actually running. The failed transmission-temperature field is part of the result, not a detail to hide. If you are planning a similar small-trailer drive, our RV departure checklist covers the physical checks that data logging cannot replace.
Keep building capability
Take the next trip with a better plan.
Join the Out West Club and get the free 25-Point RV Departure Checklist—plus occasional practical notes for travel, connectivity, preparedness, and gear.